
🔴Just one example of how the CDC manipulated data to set the COVID-19 narrative.
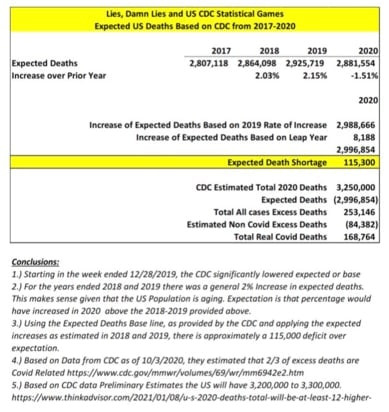
Historically, the CDC raises the excess death threshold (orange line) by ~2% per year. But in 2020, they lowered the expected death baseline by 1.5% from 2019. So rather than increasing the expected baseline by 2%, expected deaths for 2020 moved in the opposite direction by 3.5%.
EXPECTED DEATHS
2017 - 2,807,118
2018 - 2,864,098 (+2.03%)
2019 - 2,925,719 (+2.15%)
2020 - 2,881,554 (-1.51%)
Excess deaths are obtained by subtracting two numbers: the number of deaths and the expected excess number of deaths. Therefore, the number of excess deaths is determined by how the excess death threshold is calculated.
Lowering the excess death threshold inflated the number of excess deaths in 2020 by around 115,000 deaths & it also ensured that the weekly death rates (blue bars) remained above the excess death threshold (orange line) for the entire year.
Subscribe: KanekoaTheGreat
🔵2pics
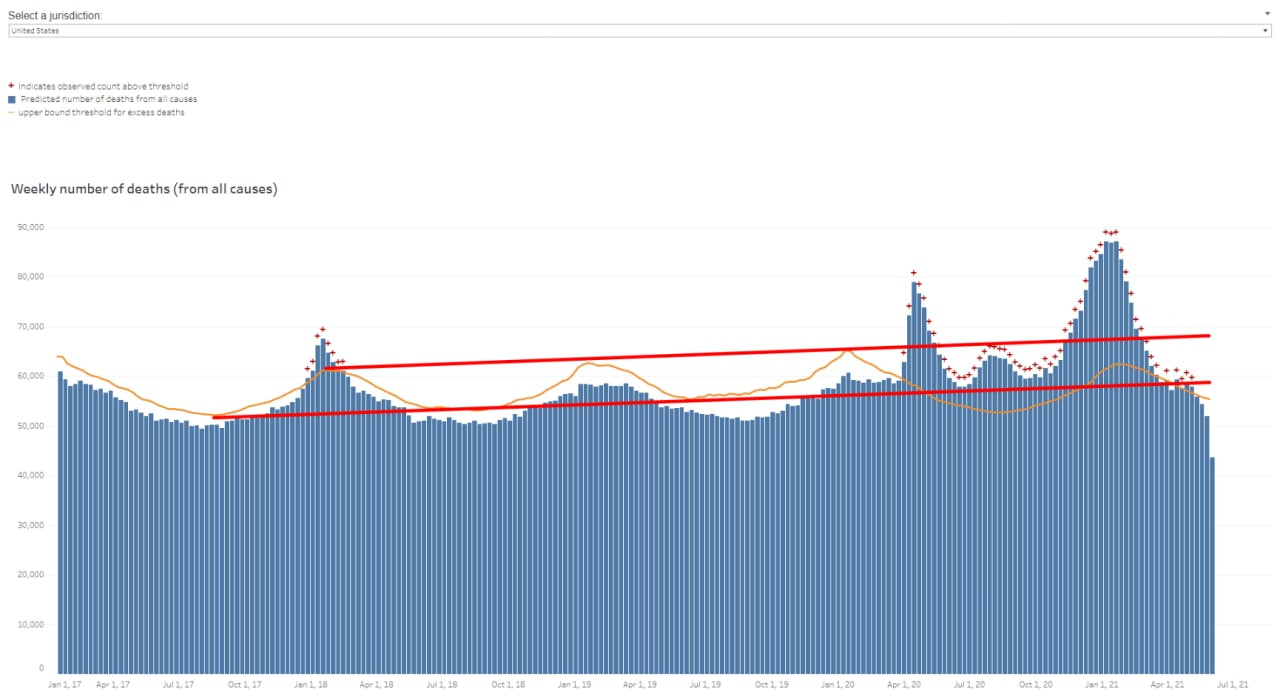
03:09 PM - Jun 12, 2021
Only people mentioned by r363ll10n in this post can reply